Explore ShopInsight With Live Demo Data
Navigate a real dashboard with behavioral analytics from a fictional Shopify store.
Demo Store: "Urban Threads"
Store Information
- Name: Urban Threads
- Industry: Sustainable streetwear
- Price Range: $40-120
- Traffic: 8,500 visitors last month
- Conversion Rate: 2.1% (below industry average)
Demo Features
- Real-time behavioral analytics
- Session browser with detailed timelines
- Scroll depth and image engagement
- Device performance comparison
- Pattern-based observations
Dashboard Overview
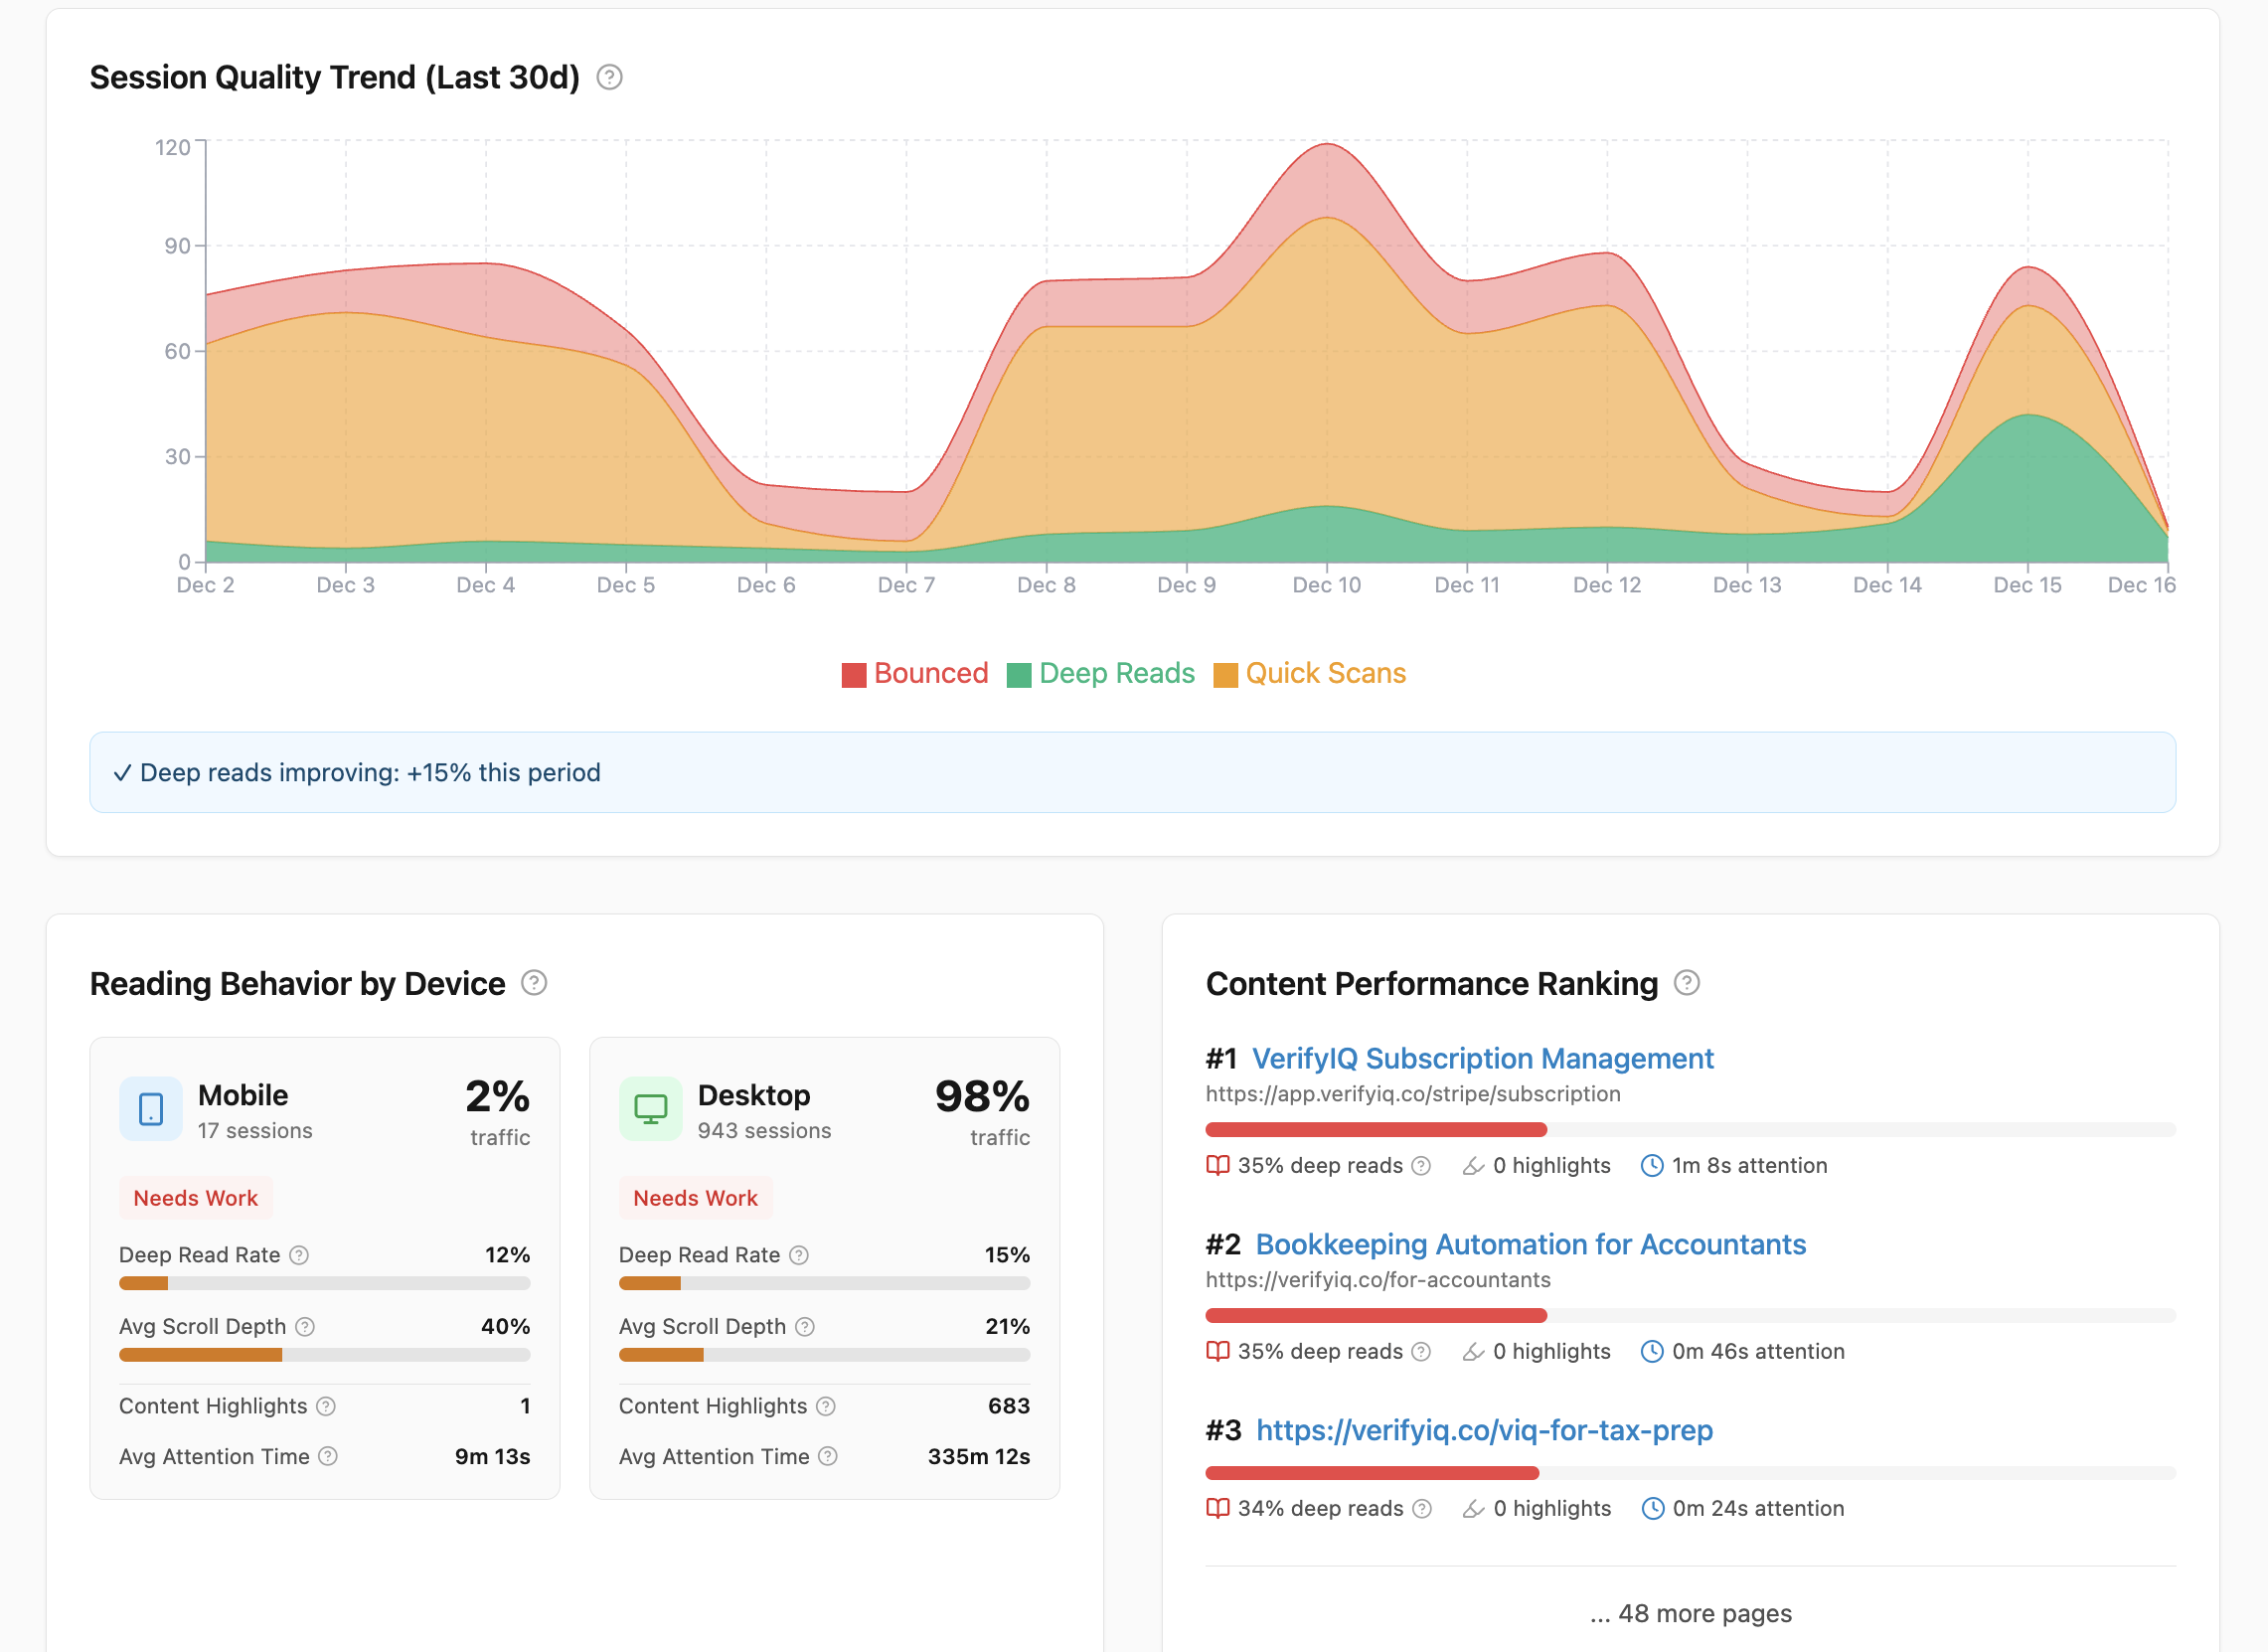
Session Quality Trend
Mobile vs Desktop
Deep Read Rate: Desktop 41% vs Mobile 23%
Deep reads improving: +13% this period
Visitors are spending more time reading product descriptions and reviews. This suggests your recent content updates are working.
Live Dashboard Overview
Track real-time behavioral analytics with comprehensive metrics and pattern detection across all visitor sessions.
- •8 key metrics: sessions, deep reads, scroll depth, highlights, hovers, and more
- •Session quality trends showing visitor engagement over time
- •Mobile vs desktop performance comparison
- •Automatic pattern detection like 'Deep reads improving: +13%'
Site Analysis
Scroll Analysis
Scroll Depth Distribution
Pattern: 86% of visitors never scroll past 50%
Consider moving key content higher on the page
Image Engagement
Top Engaged Images
Avg Attention: 4.2s
Re-viewed: 23% of sessions
Avg Attention: 3.8s
Re-viewed: 31% of sessions
Avg Attention: 0.8s
Re-viewed: 4% of sessions
Click Tracking
Top Clicked Elements
Dead Clicks: 47 clicks on non-interactive elements
Users trying to click product thumbnails that aren't clickable
Device Analysis
Performance by Device
Mobile bounce rate 14% higher than desktop
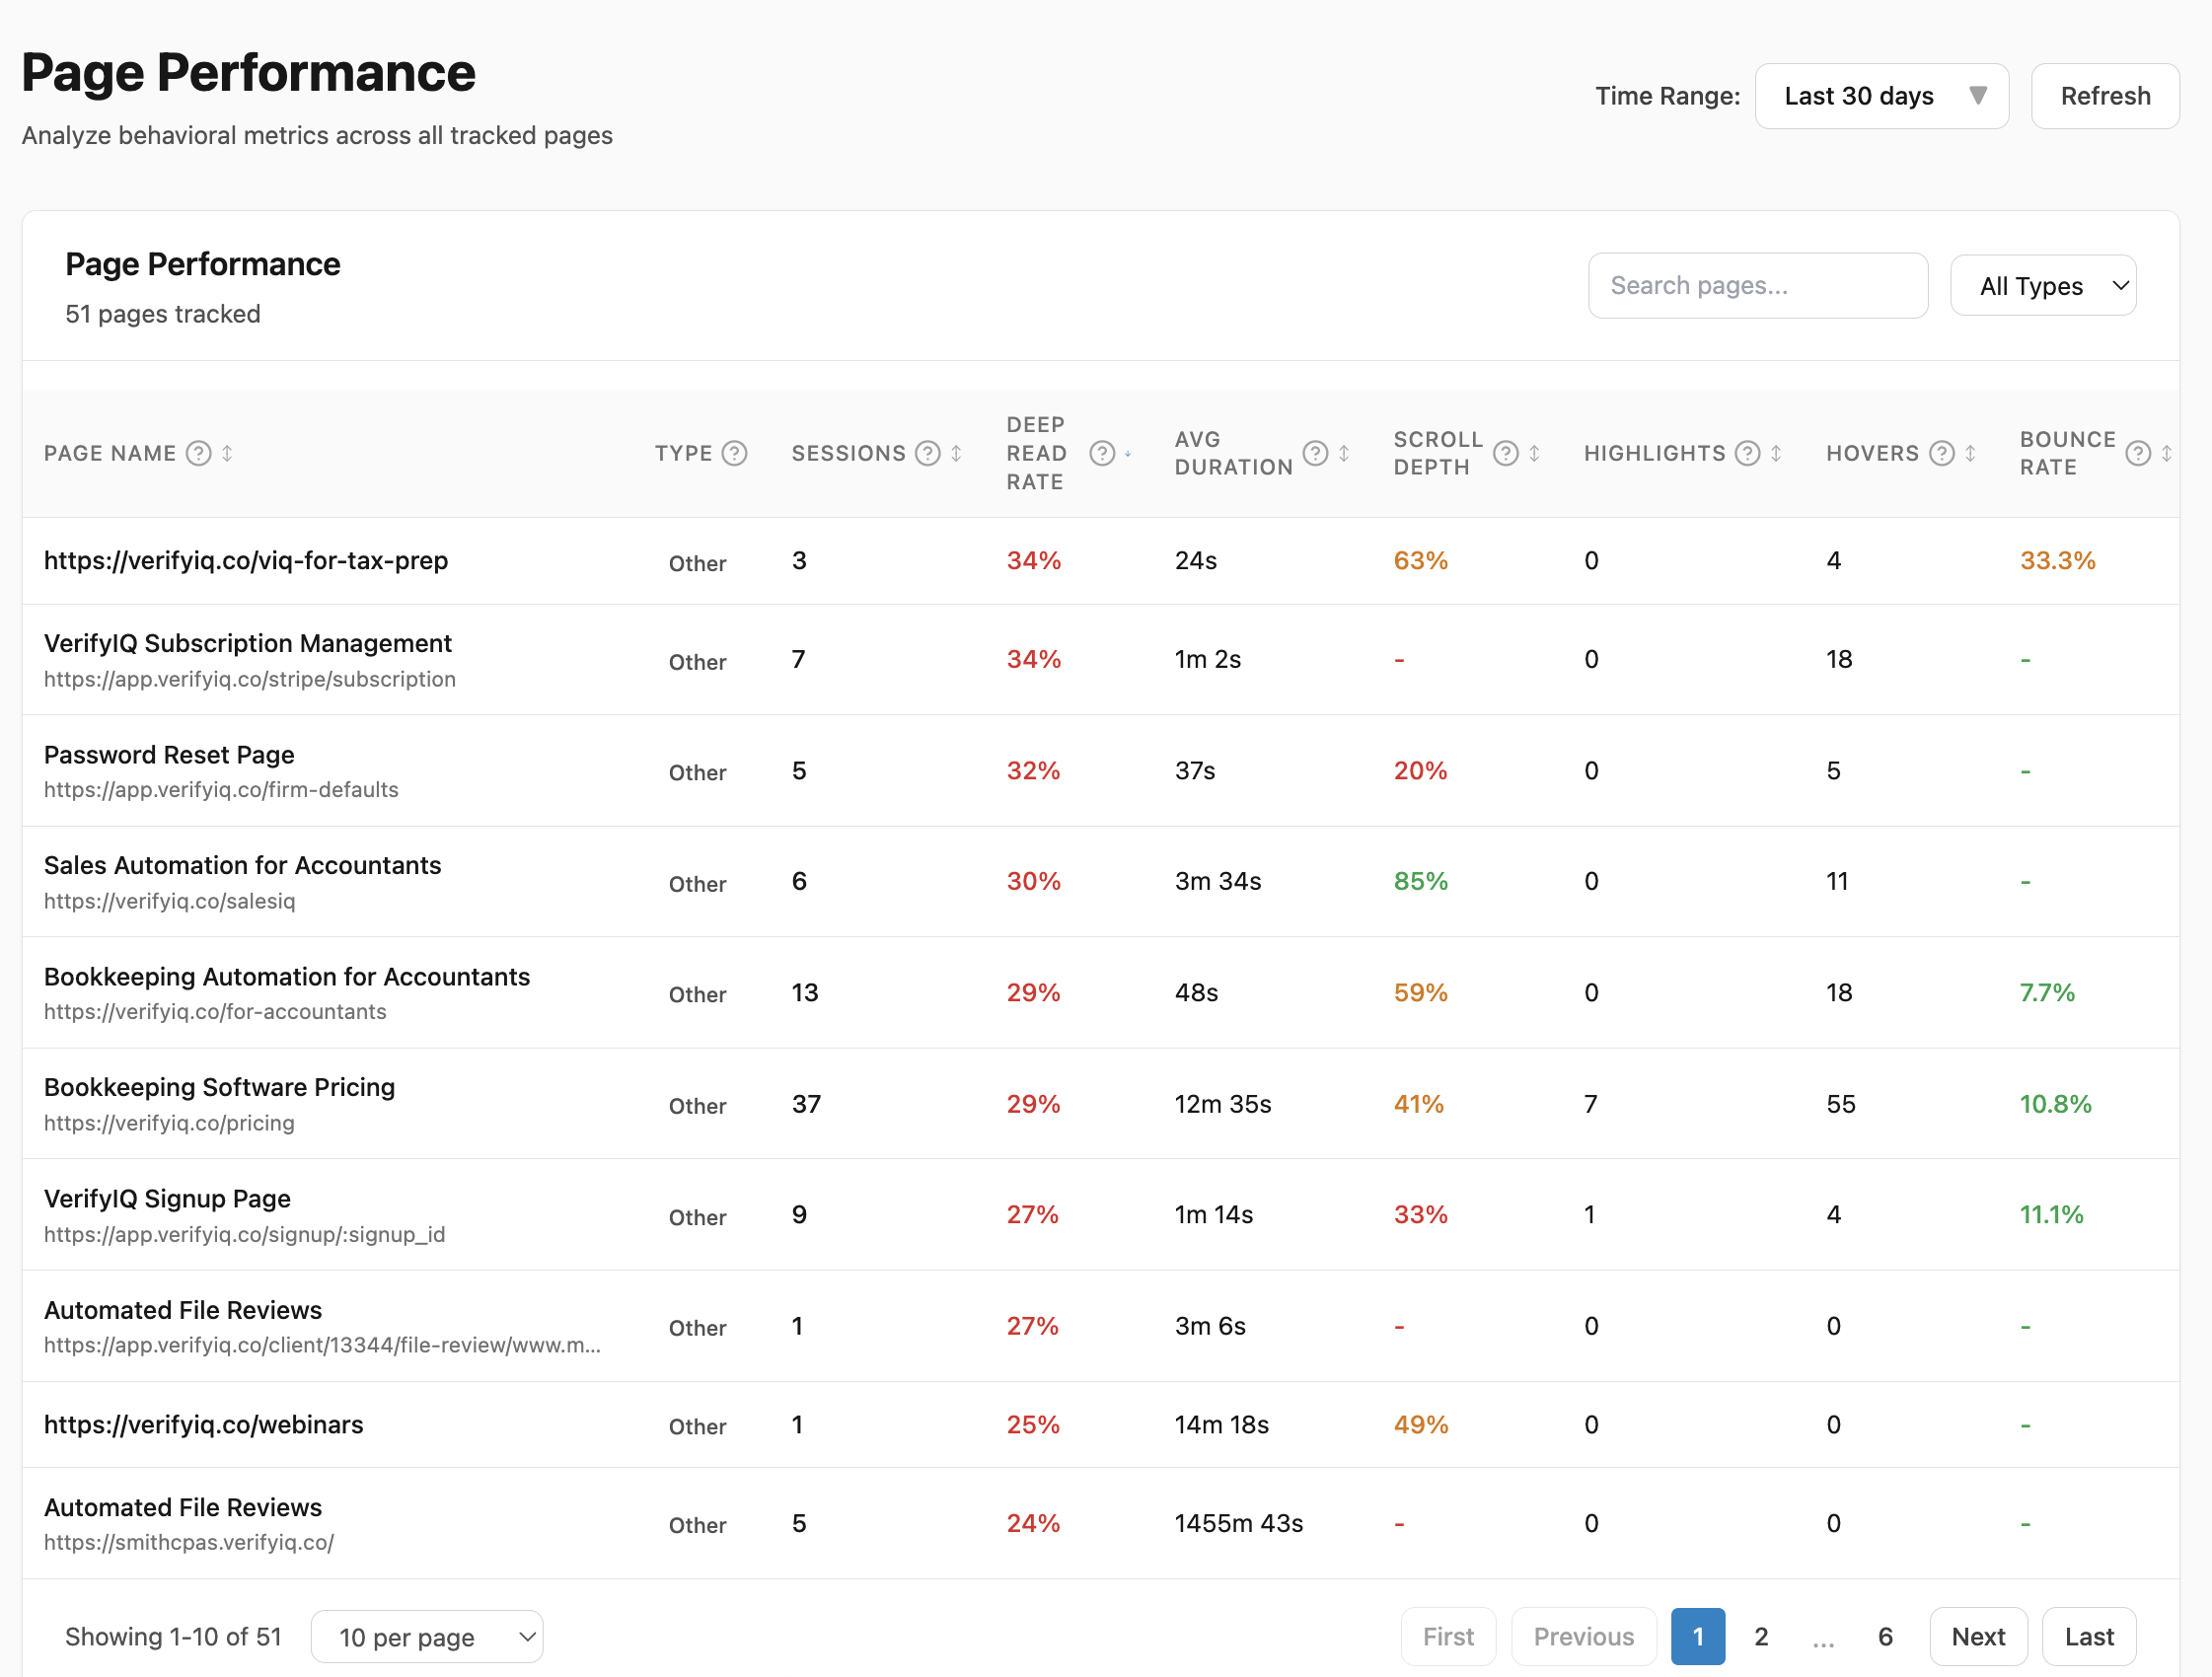
Pages Performance
| Page | Sessions | Deep Read Rate | Avg Scroll | Bounce Rate |
|---|---|---|---|---|
| /products/vintage-denim-jacket | 342 | 38% | 68% | 22% |
| / | 892 | 32% | 64% | 28% |
| /collections/new-arrivals | 247 | 26% | 58% | 35% |
| /pages/about | 156 | 18% | 42% | 48% |
Pages Performance Table
Compare engagement metrics across all your pages. Sort by deep read rate, scroll depth, or bounce rate to identify top and bottom performers.
- •Sortable table showing all tracked pages
- •Deep read rate, scroll depth, and bounce rate per page
- •Click any page to view detailed behavioral analysis
- •Identify which pages need optimization
Session Browser
Sample Session #8473
DEEP READDate: Dec 10, 2024 4:23pm
Duration: 3m 18s
Device: Desktop (Chrome)
Engagement Score: 87/100
Pages Visited: 4
Total Interactions: 23
Avg Scroll Depth: 78%
Keywords: size, fit, measurements, shipping
Session Timeline:
Behavioral Highlights:
Highlighted product description text (2 selections)
Hovered on size selector multiple times (4s total)
High engagement with product details (86% scroll depth)
Visited size guide before purchasing (positive signal)
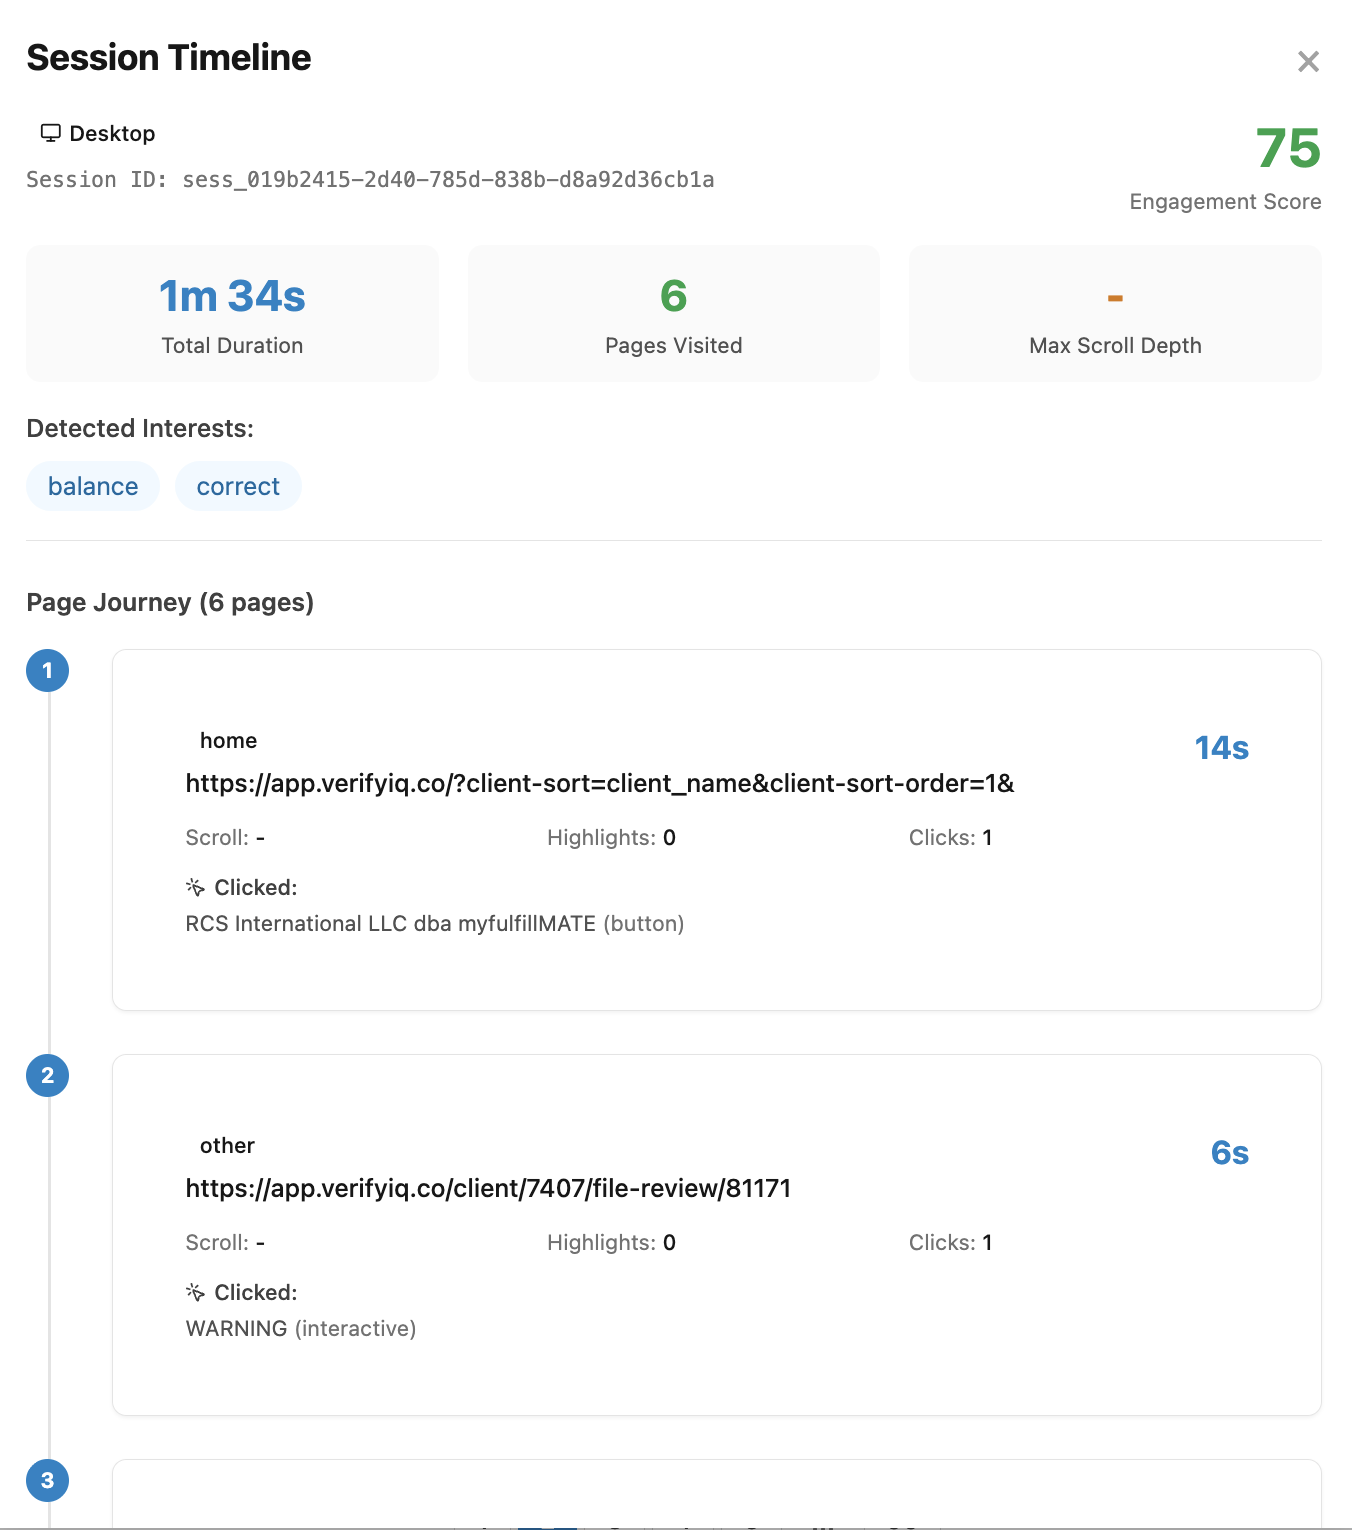
Individual Session Details
Dive deep into any session to see the complete visitor journey with behavioral event timeline and engagement analysis.
- •Full session timeline with page journey and timestamps
- •View all highlights, hovers, clicks, and scroll depth per page
- •Engagement score and behavioral highlights
- •Keyword tags extracted from user behavior
Ready to see YOUR store's behavioral analytics?
Install ShopInsight free and start tracking behavioral data immediately. See exactly how visitors interact with your store.
No credit card required • Start tracking immediately • Free tier available